New Track
Open ‘New Track’ by pressing the tab-bar button at the bottom of the screen.
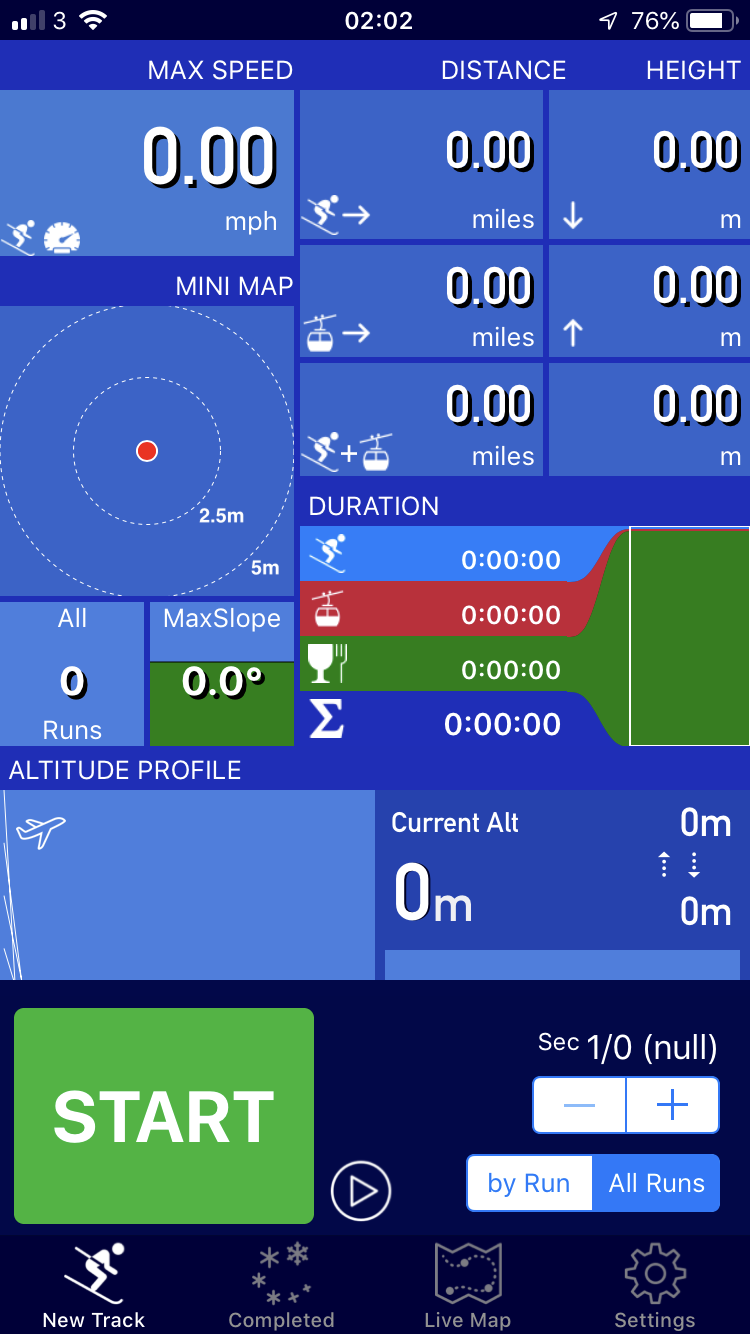
New Track is the the place that lets you start recording for a day out on the slopes. To start recording, press ‘START’. You can’t miss it, it’s the great big green button. You know when you have hit it, as the big button will disappear and be replaced with some smaller buttons. These are:
HALT - temporarily halt the recording of new data. This saves a small amount of energy if you are really worried about that, but, otherwise we encourage you to just keep recording all day. SkiMax will pick up on when you are resting or eating and this time will be allocated to ‘REST’. If you leave SkiMax recording, then SkiMax is better able to determine your activity.
When you have finished your day, press HALT, then ‘STOP’. (The RED button.) This will stop and then save your whole day’s data.
SkiMax auto-saves every couple of minutes anyway, so if you accidentally close SkiMax, don’t worry your data will have been saved. (At least up to the last two minutes).
If you do feel the need to HALT the recording, pressing the green button ‘RESUME’ will restart recording.
So what does HALT actually do?
When HALT is in force, SkiMax requests the iphone to disable the collection of your location data. This saves some battery power, but, SkiMax has been designed to be running for the whole ski-day so you’ll only need to consider this in extreme circumstances.
Parts of the New Track screen...
There is quite a bit of information on the New Track screen. It’s all pretty simple so don’t be worried. The areas of this screen are accessible by scrolling the page downwards and upwards as you see fit. As you do this you’ll see some different looking areas
MaxSpeed
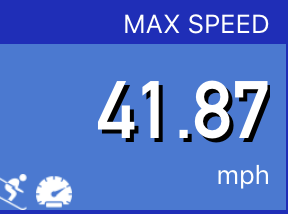
What could be simpler than your Maximum Speed. This item shows your maximum speed obtained while Skiing. If you happen to set your top speed while sitting in a lift or a gondola, then this will not count. Always be safe and never ski outside your ability level in an effort to bump this figure up.
Distances
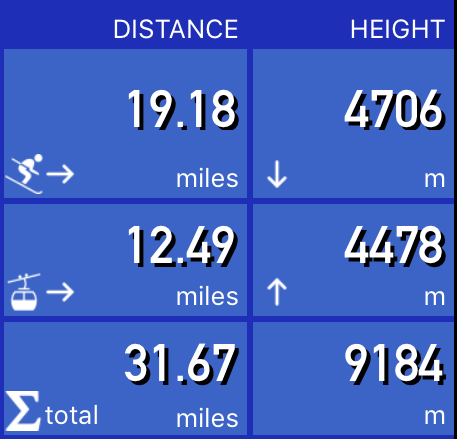
One of the most important sets of information is how many kilometres or (miles) you have skied. SkiMax also provides the height that you have skied (how far down you have travelled). Lifts are also calculated for information and the totals (skiing and lifts) are also given to complete your information.
MiniMap
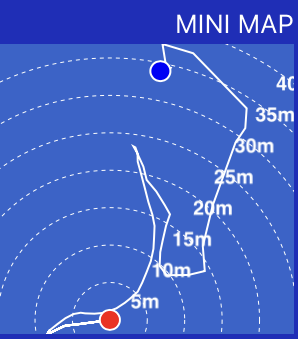
This is a tiny map showing were you have travelled, with all other detail removed for simplicity. When you START a recording, a BLUE dot is placed on the MiniMap. As you then move around your current location is given by the RED dot. Distance lines are always drawn outwards from your current position so you can see how far you are away from other visited areas.
Duration
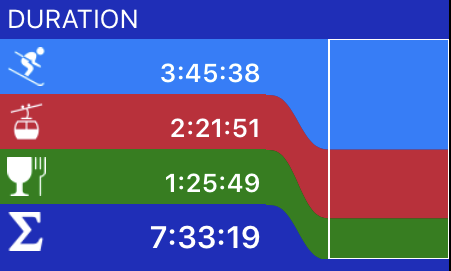
This little section gives you a breakdown of how you have spent your day. Time spent skiing, time in Lifts, and time spent just resting are all calculated. Total time for all activities is given also. This can help you maximise where you want to spend your time, be it skiing, or sitting in a restaurant. It also alows you to compare resorts based on ski-to-lift ratios.
Altitude Profile
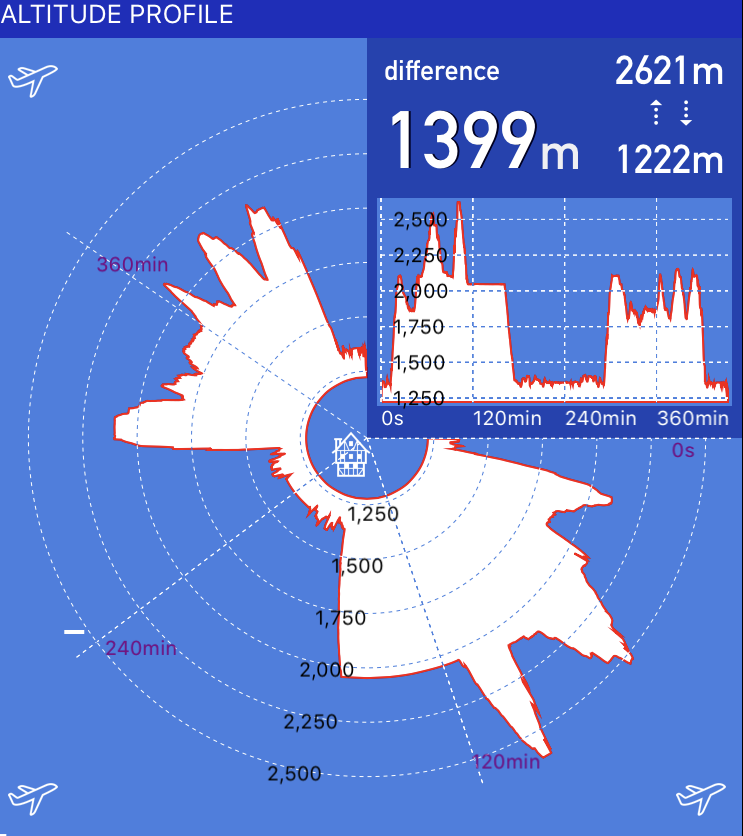
The Altitude Profile area shows two views of your altitude profile for the day. This is the way your altitude has changed throughout your ski-day. Both reveal the same information. The smaller graph shows a more conventional graph, with time across the bottom axis, and height along the vertical axis. On this graph, the 0 seconds, marks the START of your day.
The larger, and perhaps the graph that looks more interesting, shows the same changes in height, but, on this graph, the time moves around a circular path. 0 seconds, is shown at the 3 o’clock position, and this represents the start of your ski-day. Time then sweeps around in a clock-wise fashion. If your altitude doesn’t change, maybe because you are in a restaurant, then a segment of a circle is traced out showing that you were at the same altitude for a period of time. (This happens just before 120 mins on the image above, and lasts for around 60 minutes.)
We just felt that this type of representation was more interesting than the conventional altitude graph. It gives you opportunities to ski ‘shapes' and create interesting patterns with your altitude.
Altitude Profile
The Altitude Profile area shows two views of your altitude profile for the day. This is the way your altitude has changed throughout your ski-day. Both reveal the same information. The smaller graph shows a more conventional graph, with time across the bottom axis, and height along the vertical axis. On this graph, the 0 seconds, marks the START of your day.
The larger, and perhaps the graph that looks more interesting, shows the same changes in height, but, on this graph, the time moves around a circular path. 0 seconds, is shown at the 3 o’clock position, and this represents the start of your ski-day. Time then sweeps around in a clock-wise fashion. If your altitude doesn’t change, maybe because you are in a restaurant, then a segment of a circle is traced out showing that you were at the same altitude for a period of time. (This happens just before 120 mins on the image above, and lasts for around 60 minutes.)
We just felt that this type of representation was more interesting than the conventional altitude graph. It gives you opportunities to ski ‘shapes' and create interesting patterns with your altitude.
Altitude Readouts
Current or Range of Altitude
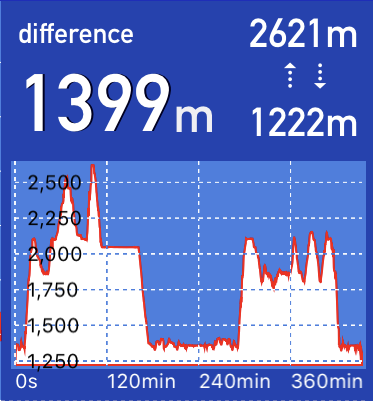
The mini-altitude panel embedded in the main Altitude Profile graph shows your current maximum and minimum altitudes obtained for your day.
On historical tracks, the largest number displays the ‘difference’ between minimum and maximum, effectively the ski-height range that you have skied. In this case, the label will state ‘difference’ (as in the top image).
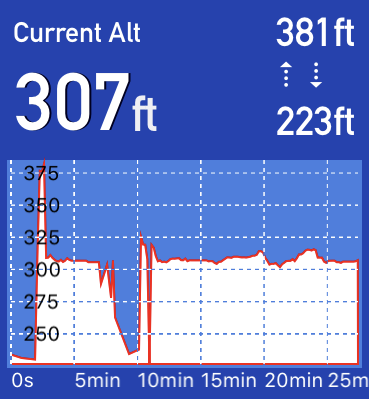
On LIVE recordings, and assuming you are currently receiving location updates, the BIG number shows your current altitude. The label changes to ‘Current Alt’ to let you know what’s being reported. You may occasionally see the ‘Current Alt’ change to ‘difference’. This only happens when a fresh location has not been received for a period of ten seconds.
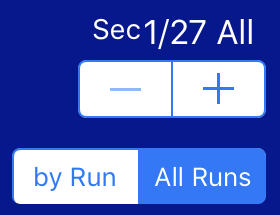
Runs and Slope
This double-section lets you know how many different activities SkiMax has determined you have performed during your day (here 27). A run can be either skiing, in or on a lift, or just simply resting. If the control button at the bottom is seleting ‘All Runs’ then the data reflects the total run-count. In this mode, the Avg Slope panel reports the average slope calculated from all SKI-runs. For this the lifts are not considered.

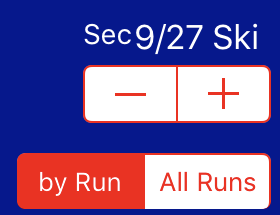
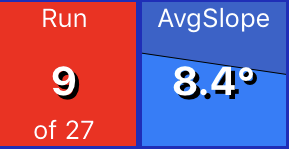
On the other hand, if the control button at the bottom is selecting ‘by Run’, then, the data presented on the whole page is restricted to reporting just the selected run. The run is then determined by the -/+ buttons. The run selected is then shown in the left hand panel (now coloured red). In this mode the Avg Slope panel shows the Average slope calculated for the selected run, in this case, run 9. The red colour is used to show you that the data on this page is now just showing data for a single run. Without this, it’s easy to get confused and to think that your data is not being updated live. (So, tip, if you see RED on this page, you know that the data is ONLY valid for the selected run.)

Copyright © 2019 Just-the-Biz Limited.
All rights reserved.